All charities – whatever their size – need a strategic plan and the start of a new year is the perfect time to begin thinking about yours. A quick look into the future demonstrates that charities must be ready to navigate uncertainties and tackle big challenges. Here are some top tips on why charities need a strategy and how to get started writing one.
Top reasons why charities need a strategy:
- In a world of rapid change, planning how to navigate uncertainties and tackle big challenges has never been more pressing. The winds of change also bring significant untapped potential for charities to diversify their income, embrace digital technologies and benefit from people living healthier and wealthier lives.
- And yet, despite us living in times which call for more and better planning, charities struggle to formulate strategic plans effectively while those that do manage it then report that they’re failing to see breakthrough performance on the ground.
- A strategic plan will align charity staff and board members with a common understanding of where the organisation is going and how it should make decisions on priorities, resourcing and investments. It serves as a compass in the way that the discipline of a bottom line serves to guide a business
- These ten graphics show why we think that every charity of every size should have a strategy.
#1: Falling public confidence casts a cloud on all charities, with impacts yet unknown
#2: Small and medium charities are suffering the most
#3 Don’t give up on cash
#4 Government and council statutory income is declining and biased towards larger organisations
#5: The funding crisis will continue for another decade (social care example)
#6: The freedom to trade and earn income is an opportunity to be seized
#7: Social media evens the playing field for everyone
#8: Fewer people are donating to charity
#9: Our ageing population is a boon for charities
#10: Data from the 2021 Census
#1: Falling public confidence casts a cloud on all charities, with impacts yet unknown
Trust in charities has been hit by recent stories such as the news about the actions of Captain Tom Moore’s daughter and the loss of almost £3m in donations through fraud in 2022.
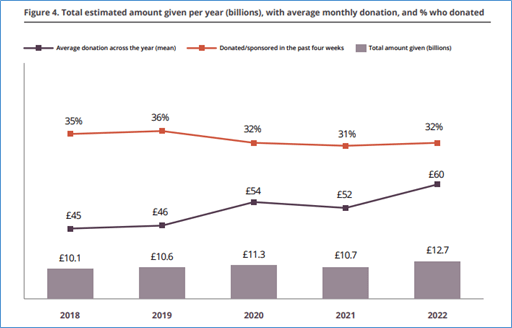
The CAF Giving Report for 2022 found that fewer people are donating or sponsoring someone compared with previous recent years (but that there has been an increase in the average (mean) monthly gift among those who have donated). This indicates that the increase in total donations in 2022 was due to donors increasing the amount donated or sponsored (perhaps to take account of inflation), and not a result of more people donating or sponsoring.
Total Estimated Amount Given per Year (Billions) with Average Monthly Donations and % Who Donated
#2: Small and medium charities are suffering the most
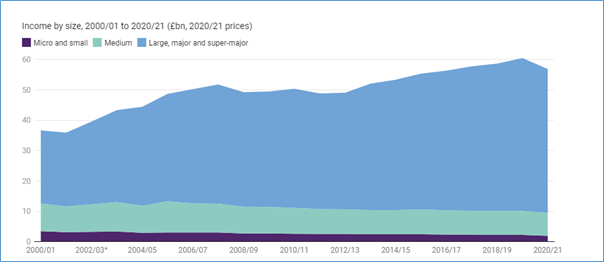
After adjusting spend in previous years for inflation (2020/21), NCVO reported that combined income fell for charities of all sizes. There was a faster rate of decline (35%) for micro and small organisations (falling from £3.1bn in 2007/08 to £2bn in 2020/21 which is just 3.6% of the sector’s total income).
Medium organisations’ total income fell from £9.5bn to £7.5bn (a 20% decline) during the same period.
83% of the sector’s income is generated by large, major and super-major voluntary organisations (income over £1m). From 2007/08 to 2020/21, their income grew by 20% from £39.2bn to £47.3bn, although recent declines mean it is now back at 2017/18 levels.
Income by Size 2000 to 2021 (NCVO)
#3 Don’t give up on cash
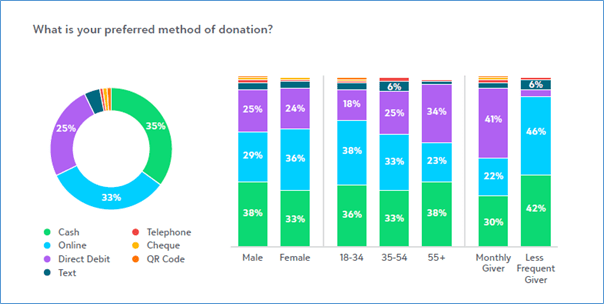
Cash is still the way that many people prefer to donate and perhaps surprisingly this applies across all age groups. According Blackbaud research into UK donor behaviour, under 35s are the age-group most likely to donate online, with older people (55+) preferring to give monthly via Direct Debit. Less frequent givers are most likely to donate online, on an ad-hoc basis.
UK Preferred Donation Methods 2023 (Blackbaud)
#4 Statutory income is not growing and biased towards larger organisations
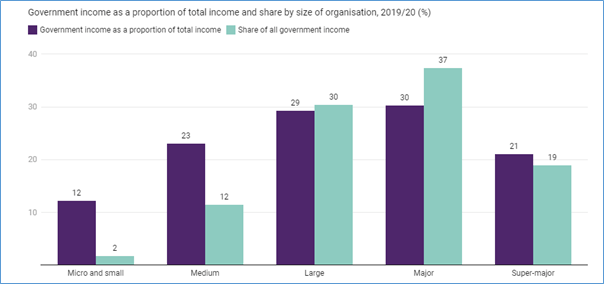
NCVO’s analysis of income from the government shows that at £16.8bn it makes up 30% of the sector’s total income of which three-quarters is for contracts. Over the last decade, central government funding has been relatively static while local government funding has declined steadily over time.
Only very large charities can engage successfully in a commissioning environment that increasingly favours having resources and capacity to deliver public services at scale.
Government Income as a proportion of total income and share by size of organisation 2019/20
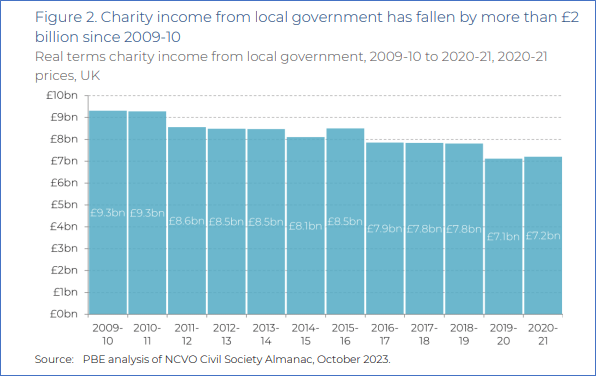
Local government is an important source of charity sector income, with grants and contracts funding about 13p in every £1. This funding has been in decline over the past decade, as austerity and recent well-publicised budget issues have led to a 23% real terms drop in local-government sourced charity income.
Research published by the think tank Pro Bono Economics and Nottingham Trent University found that charities have lost more than £13bn in council funding since 2010 and 28 per cent of charities in England that work with local councils expect funding to fall further.
more than £13bn in council funding since 2010 and 28 per cent of charities in England that work with local councils expect funding to fall further.
The research found that nine in 10 charities working with local councils described the relationship as “important”, and four in 10 described it as “critical”.
https://www.independent.co.uk/news/uk/charities-data-b2504386.html
https://www.probonoeconomics.com/news/turmoil-in-local-government-threatens-charity-services
#5: The funding crisis will continue for another decade (social care example)
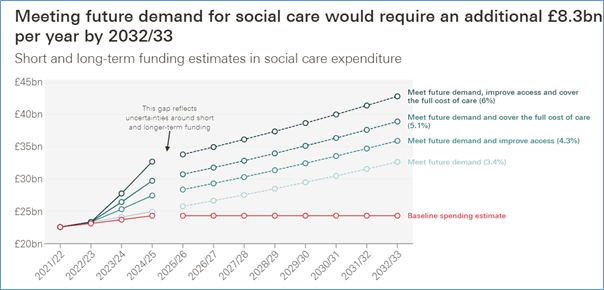
Unfortunately, we are not out of the woods. Charity funding is going to continue being dominated by serious shortfalls for adult social services, housing, education, leisure and libraries well into the 2030s. In adult social care, for instance, a spending shortfall of £8.3bn is predicted to be required by 2032/33 according to Health UK’s figures.
Health Foundation analysis of NHS Digital, Adult Social Care Activity and Finance Report 2021/22
#6: The freedom to trade and earn income is an opportunity to be seized
It’s not all doom and gloom, though, as many charities have responded to austerity by innovating and finding ways to increase trading income. In fact, a spirit of enterprise has swept UK charities with about 60 per cent of organisations in the third sector earning a proportion of their income by delivering contracts or self-generated trading of goods or services.
Community Foundation reports that the proportion which earn more than 80 per cent of their income from trading has fallen since 2013 (from 20% to 14%), while the percentage of organisations earning less than a fifth of their income has risen (from 21% to 26%). The overall proportion of organisations trading has not increased but has fallen slightly, but steadily, from 68 per cent in 2013 to 66 per cent in 2022.
Change in patterns of earned income 2013 to 2022 (Community Foundation)
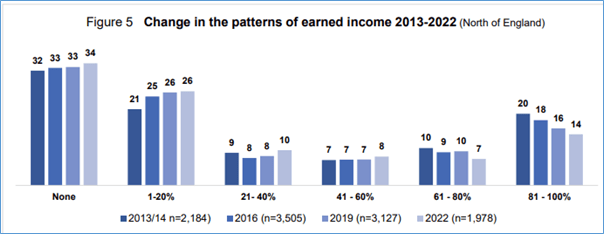
Note that the data in this chart is for the North of England.
#7: Social media evens the playing field for everyone
While different social media channels have different audiences, terminology, word counts and image requirements, scheduling and publishing tools such as Hootsuite, Buffer, Loomly, Metricool and Canva have free options or discounts for charities and enable users to create attractive posts that meet the requirements of the social media tool and also schedule posts in advance. AI can also help with grammar and spell checking and condensing text to meet character count requirements but from my experience it’s not there yet for complete copy or hashtag generation (Marina Stedman, Marketing & Comms Manager).
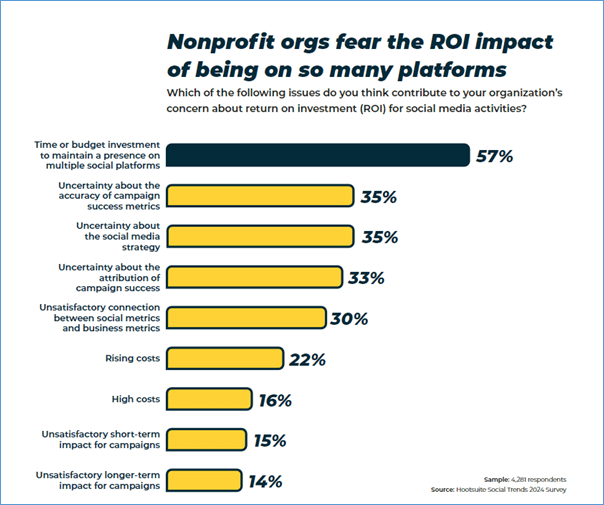
Hootsuite’s research found that one of the not-for-profit sector’s biggest concerns is managing the ROI across so many social media platforms. Don’t try to post on everything, everywhere, focus on the platforms that your biggest target audiences use.
The best advice for small and medium charities is to focus on building your brand on targeted social media channels rather than trying to be on all of them. Most tools have comprehensive reporting functionality that helps identify which platforms are working and which aren’t.
The Hootsuite Non-Profit Social Media Trends Report for 2024 highlights some of the key points that not-for-profit organisations should consider.
#8: Fewer people are donating to charity
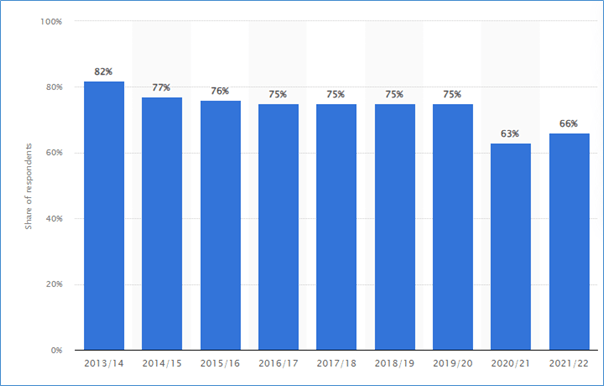
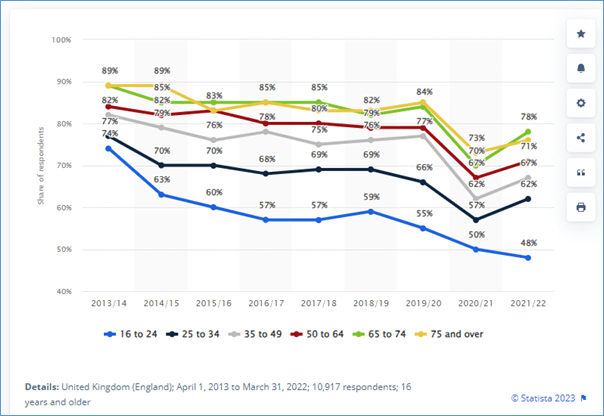
Statista reports that approximately 66 percent of people in England said that they gave to charity in 2021/22, compared with 82 percent in 2013/14. Over that time period, the share of people giving to charity has gradually declined, reaching a low of 63 percent in 2020/21.
% of respondents who give to charity 2013 to 2021-22 in England (Statista)
#9 Our ageing population is a boon for charities
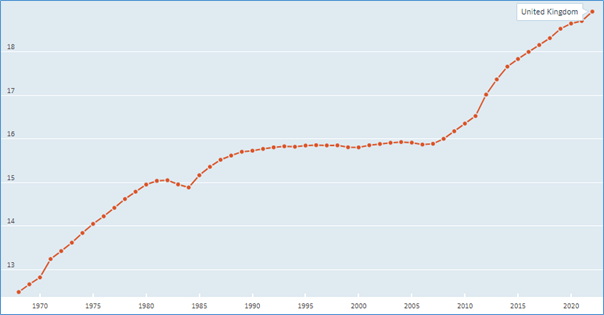
The OECD reports that the percentage of the population aged 65 and over in the UK increased from 12.5% in 1968 to 18.92% in 2022 and is expected to be 25% by 2050. Longer, healthier lives mean that a new stage of life is emerging between the end of the conventional working age (65 years old) and the onset of old age as it used to be understood (85 years old).
Charities which can make the right ‘ask’ are set to be the real winners from what The Economist calls a ‘longevity dividend’. After all, the over-65s are the most willing and able to donate and have a wealth of professional experience and skills to offer causes which enable them to continue to remain productive.
Statista found that people that were aged between 65 and 74 were the most likely age group to give to charity in England and Wales in 2021/22. By contrast, those aged between 16 and 24, the youngest age group surveyed, were the least likely to give to charity, at 48 percent.
#10 Data from the 2021 Census
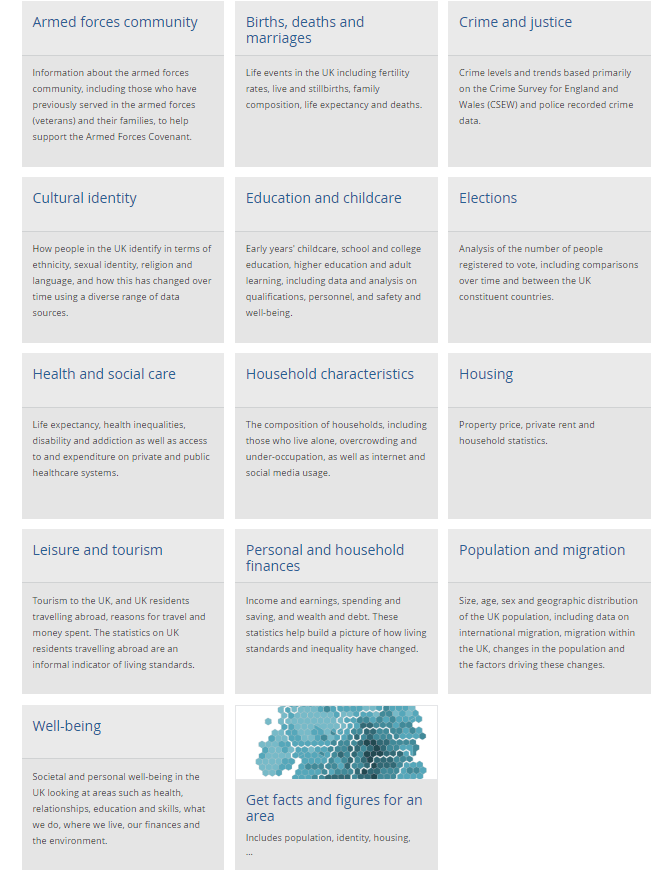
We’re cheating a bit here because the UK Census isn’t one chart or information source but a picture of all the people and households in England and Wales based on a 10 year survey undertaken by the Office for National Statistics every 10 years.
By asking questions about individuals, their households and their homes, it builds a detailed snapshot of society that is a valuable planning resource.
There are tools that allow you to filter the data according to your own needs (by area, ethnicity, employment, population, heath and social care, trade, crime and the economy for example).
Can we help your charity with its strategy, governence and planning?


